Alerts
Navigation: Sidebar → Alerts
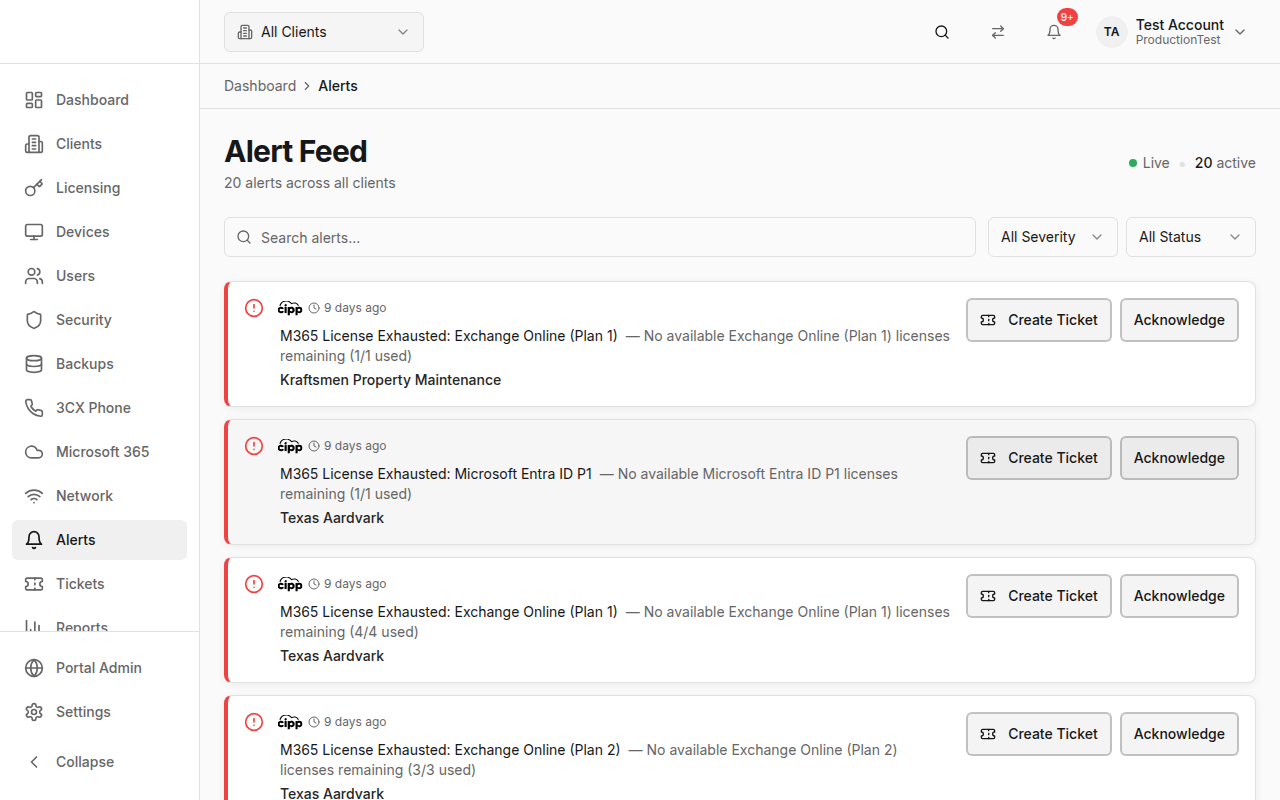
The Alerts page is your cross-platform alert feed. It aggregates alerts from all connected integrations into a single, filterable, real-time stream.
Overview
The alert feed shows:
- Live Indicator — Pulsing green dot confirming real-time updates
- Active Count — Number of unacknowledged alerts
- Alert List — All alerts sorted by severity, with the most critical first
How Alerts Get Here
Alerts are collected from multiple sources:
- NinjaOne — RMM alerts (device offline, disk space, etc.)
- SentinelOne — Security threat detections
- Checkpoint — Email security events
- Microsoft 365 — Security alerts from Defender
- UniFi — Network infrastructure alerts
- System — PanelOne-generated alerts (SLA breaches, license expiry, etc.)
Alerts sync automatically during data syncs and can also arrive via webhooks for real-time delivery.
Alert List
Each alert displays:
- Severity Icon — Color-coded by severity (critical, high, medium, low, info)
- Alert Title — Description of what happened
- Alert Description — Additional context
- Client Name — Which client is affected (or "System" for platform alerts)
- Timestamp — When the alert was created
- Acknowledged Status — Whether someone has acknowledged the alert
Filtering
Search
Type to search by alert title, description, or client name.
Severity Filter
- All — Show all severities
- Critical — Requires immediate action
- High — Urgent attention needed
- Medium — Should be addressed soon
- Low — Informational
- Info — For awareness only
Status Filter
- All — Show all alerts
- Active — Unacknowledged alerts only
- Acknowledged — Already seen/handled alerts
Acknowledging Alerts
To acknowledge an alert:
- Click the Acknowledge button on the alert
- The alert moves to "acknowledged" status
- It remains in the list but is visually dimmed
Acknowledging alerts helps your team know what's been seen and what still needs attention.
Client-Scoped View
When a client is selected in the header:
- Only alerts for that client are shown
- The page description updates to show the client name
Sort Order
Alerts are automatically sorted by:
- Severity — Critical first, then high, medium, low, info
- Time — Most recent first within each severity level
Tips & Best Practices
- Check alerts at the start of every shift — Use the "Active" status filter to see what needs attention
- Acknowledge alerts as you handle them — This helps the team see what's been triaged
- Use severity filters to focus on what matters — Critical and High alerts should be your priority
- Investigate recurring alerts — If the same alert keeps appearing, there may be an underlying issue
- Configure alert rules in Settings to customize which alerts you receive and at what thresholds
Related Guides
- Security Posture — Security-specific alerts with detailed threat info
- Settings → Alert Rules — Configure alert thresholds and rules
- Dashboard — Alert count widget on the dashboard