Dashboard
Navigation: Sidebar → Dashboard (or click the PanelOne logo)
The Dashboard is your at-a-glance view of everything happening across your managed environment. It shows health scores, device status, security posture, backup health, and more — all in one place.
Overview
When you land on the Dashboard, you'll see:
- Page Header — Shows your organization name (or selected client name) and a subtitle
- Onboarding Checklist — Appears until you've completed initial setup tasks
- Health Overview Cards — Summary metrics across all clients
- Dashboard Widgets — Configurable cards showing detailed status information
Health Overview Cards
At the top of the dashboard, health overview cards provide a quick-glance summary:
- Device Health — Online vs. offline device counts
- Security Score — Composite security posture rating
- Backup Status — Healthy, at-risk, and failed backup counts
- Active Alerts — Number of unacknowledged alerts
These cards update automatically as data syncs from your integrations.
Client-Scoped View
Use the Client Selector in the header to filter the dashboard to a single client:
- When no client is selected: Dashboard shows aggregated data across all clients
- When a client is selected: Dashboard shows only that client's data, and the page title changes to the client name
This is useful for preparing for client review meetings — select the client and see their complete picture.
Customizing the Dashboard
Entering Edit Mode
- Click the Customize button (gear icon) in the top-right area of the dashboard
- The dashboard enters edit mode with a visual editor
Widget Management
In edit mode, you can:
- Show/Hide Widgets — Toggle visibility of any widget
- Reorder Widgets — Drag widgets to change their position
- Reset to Default — Restore the original widget layout
Saving Changes
- Click Save to persist your layout changes
- Click Cancel to discard changes and return to normal view
Your layout preferences are saved per-user, so each team member can have their own dashboard configuration.
Sync Status Widget
The Sync Status button in the header area shows you:
- The last time data was synced from your integrations
- Whether a sync is currently in progress
- A button to trigger a manual sync
When a sync runs, a Universal Sync Progress Dialog appears showing:
- Which integration is syncing
- Progress status (syncing, continuing, complete)
- Any errors that occurred
Onboarding Checklist
If you haven't completed initial setup, an Onboarding Checklist appears at the top of the dashboard. It guides you through:
- Connecting your first integration
- Adding clients
- Inviting team members
- Configuring security settings
The checklist disappears once all tasks are complete.
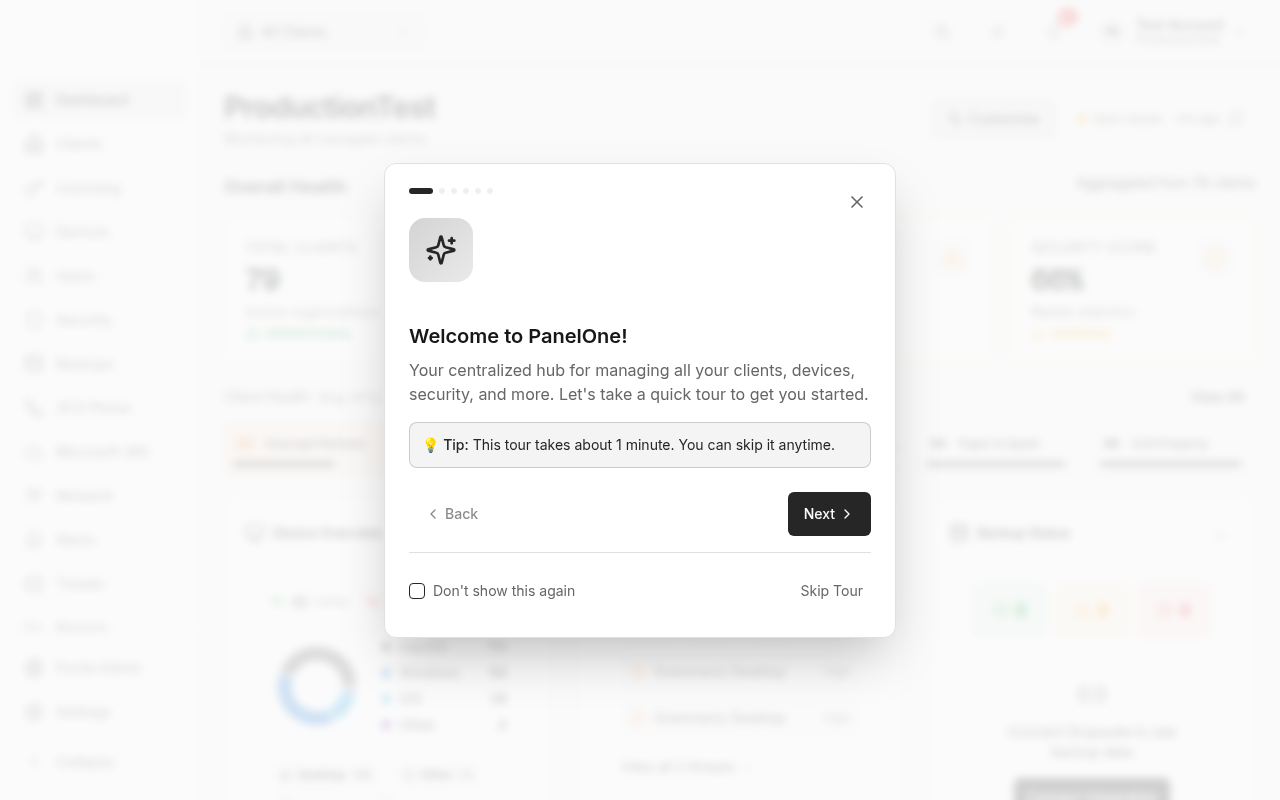
Welcome Tour
On your very first visit, PanelOne shows a Welcome Tour that highlights key areas of the interface. You can dismiss it or let it guide you through the basics.
Dashboard Widgets
The dashboard displays widgets in a responsive multi-column layout. Common widgets include:
- Device Status — Online/offline breakdown with trend
- Security Threats — Active threat count by severity
- Backup Health — Status distribution across clients
- Alert Summary — Recent alerts requiring attention
- Ticket Overview — Open tickets by priority
- Microsoft 365 Health — Service status summary
Each widget links to its detailed page — click through to investigate any metric.
Tips & Best Practices
- Start your day on the Dashboard — It's the fastest way to spot issues across all clients
- Use client filtering for scheduled client review meetings
- Customize your layout to prioritize the metrics that matter most to your team
- Keep sync running — The dashboard is only as good as your data freshness
Related Guides
- Clients — Manage client organizations
- Settings → Integrations — Connect data sources
- Alerts — Respond to alert notifications