Network
Navigation: Sidebar → Network
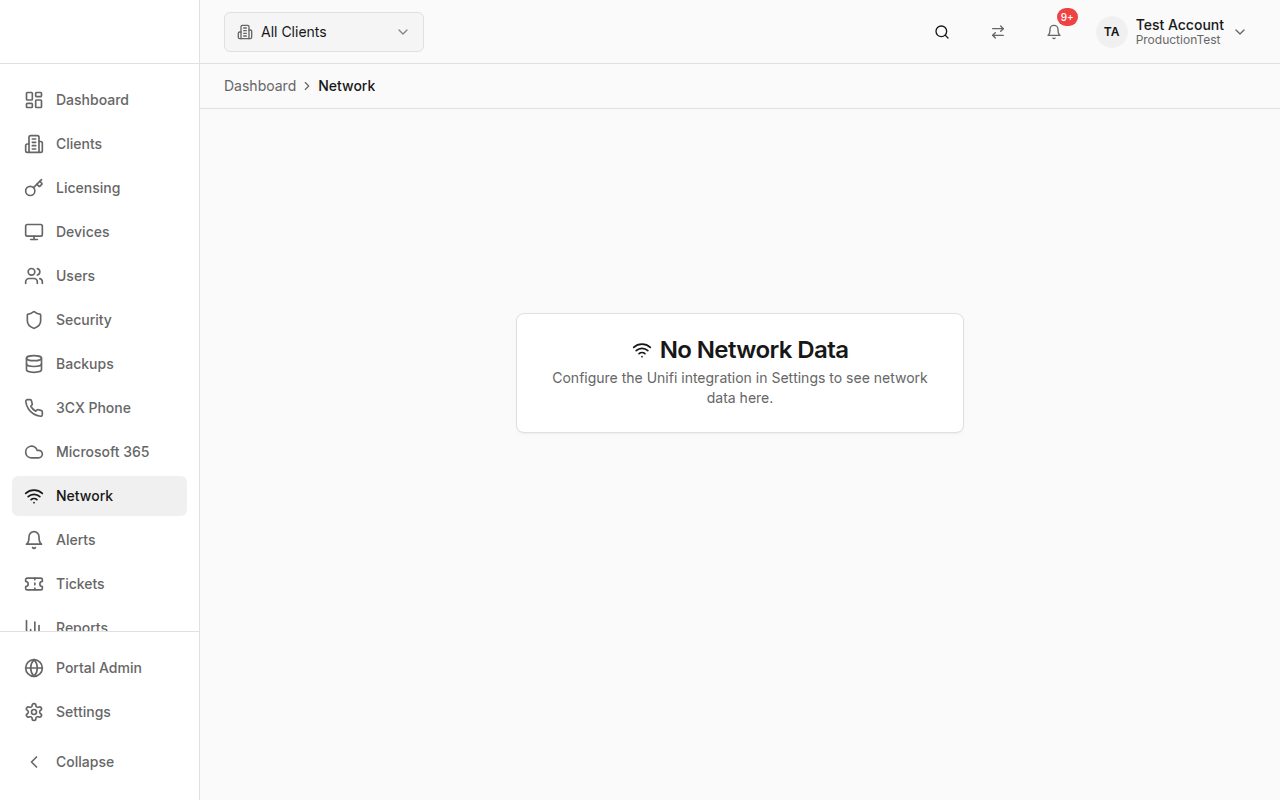
The Network page provides visibility into your UniFi network infrastructure. Monitor sites, access points, switches, gateways, connected clients, WAN health, firmware status, and more.
Overview
The Network page connects to Ubiquiti UniFi controllers and displays:
- Stats Cards — Sites, devices, clients, WAN health
- Alert Banners — Critical notifications and pending firmware updates
- Three Tabs — Sites, Devices, Clients
How Network Data Gets Here
Network data syncs from UniFi controllers via the UniFi integration.
Prerequisites:
- Enable the UniFi integration in Settings → Integrations
- Configure UniFi credentials (username, password, base URL)
- Map clients to their UniFi sites in Clients → Edit → UniFi Site ID
Stats Cards
| Card | Shows |
|---|---|
| Sites | Total sites, broken down by health (healthy/warning/critical), dual WAN count |
| Devices | Total network devices, broken down by type (APs/Switches/Gateways), offline count |
| Clients | Total connected clients, WiFi vs. wired breakdown |
| WAN Health | Sites with WAN up vs. total sites |
Alert Banners
Banners appear when issues are detected:
- 🔴 Critical Notifications — "X critical notifications across your network"
- 🟡 Pending Updates — "X devices with firmware updates available"
Sites Tab
Network sites displayed as cards in a responsive grid. Each site card shows:
- Site name (custom display name or UniFi site name)
- Health status badge (online/offline)
- Device count with type breakdown (AP, Switch, Gateway)
- Client count
- WAN IP and ISP name
- WiFi/Wired client breakdown
- Badges for: critical notifications (red), dual WAN (blue), pending updates (yellow)
Click any site to navigate to the Site Detail page for a deep dive.
Devices Tab
A table of all network devices:
| Column | Description |
|---|---|
| Name | Device name, MAC address, adoption date |
| Type | Badge with icon — Access Point, Switch, Gateway, Dream Machine, Console |
| Status | Online/Offline/Pending badge |
| IP Address | Device IP (hidden on small screens) |
| Firmware | Up to date (green) or update available (yellow) |
| Uptime | How long the device has been running |
Search by name, MAC address, or IP address.
Clients Tab
A table of connected network clients:
| Column | Description |
|---|---|
| Name | Display name, hostname, or MAC address |
| Type | Wired or Wireless, with guest badge |
| IP Address | Client IP |
| Network | SSID or network name |
| Signal | Signal strength in dBm (wireless only) |
| Traffic | Upload and download data |
| Last Seen | Time since last activity |
Search by name, hostname, MAC, or IP.
Site Detail Page
Navigation: Click any site card → Site Detail
Provides detailed information about a specific UniFi site:
- Site configuration and WAN status
- All devices at this site
- Connected clients
- WAN failover status (if dual WAN)
- Detailed statistics
Refresh
Click the Refresh button in the header to re-sync network data from all UniFi controllers.
Tips & Best Practices
- Monitor offline devices — An offline AP means a coverage gap for that client
- Check firmware updates — Keep network devices updated for security and performance
- Watch WAN health — WAN outages directly impact client operations
- Track client counts — Unusual spikes might indicate unauthorized devices
- Use the Site Detail page when troubleshooting specific client network issues
Related Guides
- Clients — Map UniFi site IDs to clients
- Settings → Integrations — Configure UniFi connection
- Alerts — Network alerts appear in the alert feed